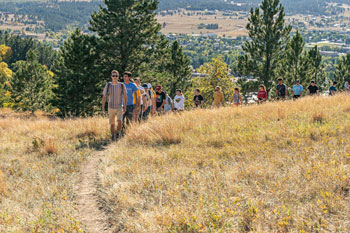
Outdoor Education
Our Outdoor Education Program prepares students for careers in adventure education and environmental interpretation through experiential learning with regional partners. Graduates work in parks, nature centers, wilderness programs, and eco-tourism settings.
More About Outdoor Education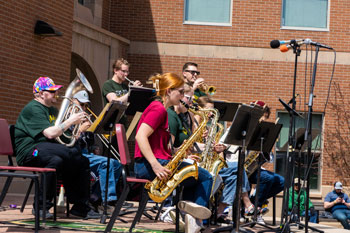
Music
Our nationally accredited Music Department offers comprehensive training with exceptional placement rates. Students develop their talents through diverse ensembles and performances in state-of-the-art facilities, supported by scholarships and experienced faculty mentors.
More About Music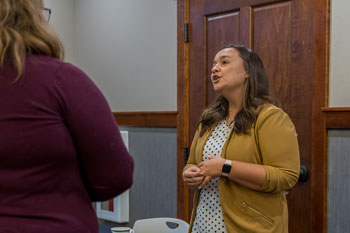
Human Services
BHSU’s Human Services program equips students with practical skills and hands-on experience to support individuals and communities. Choose from Justice Studies, Family Studies, or Community Studies to launch a career in social services or related fields.
More About Human Services